Generative AI systems can fail in ways that infrastructure metrics alone do not explain. A service may be available while retrieving the wrong evidence, selecting an unsafe tool, producing an unsupported answer, or exceeding its cost budget. AI observability combines traces, logs, metrics, and evaluation so teams can investigate these behaviors across development and production. Microsoft Learn: Observability in generative AI
Why traditional monitoring is not enough
Availability, latency, error rate, and resource utilization remain essential. They need to be paired with workflow signals such as retrieval results, model and tool calls, task outcome, safety checks, token use, and user feedback. Collect only what is needed: prompts, retrieved passages, and outputs may contain personal or confidential data.
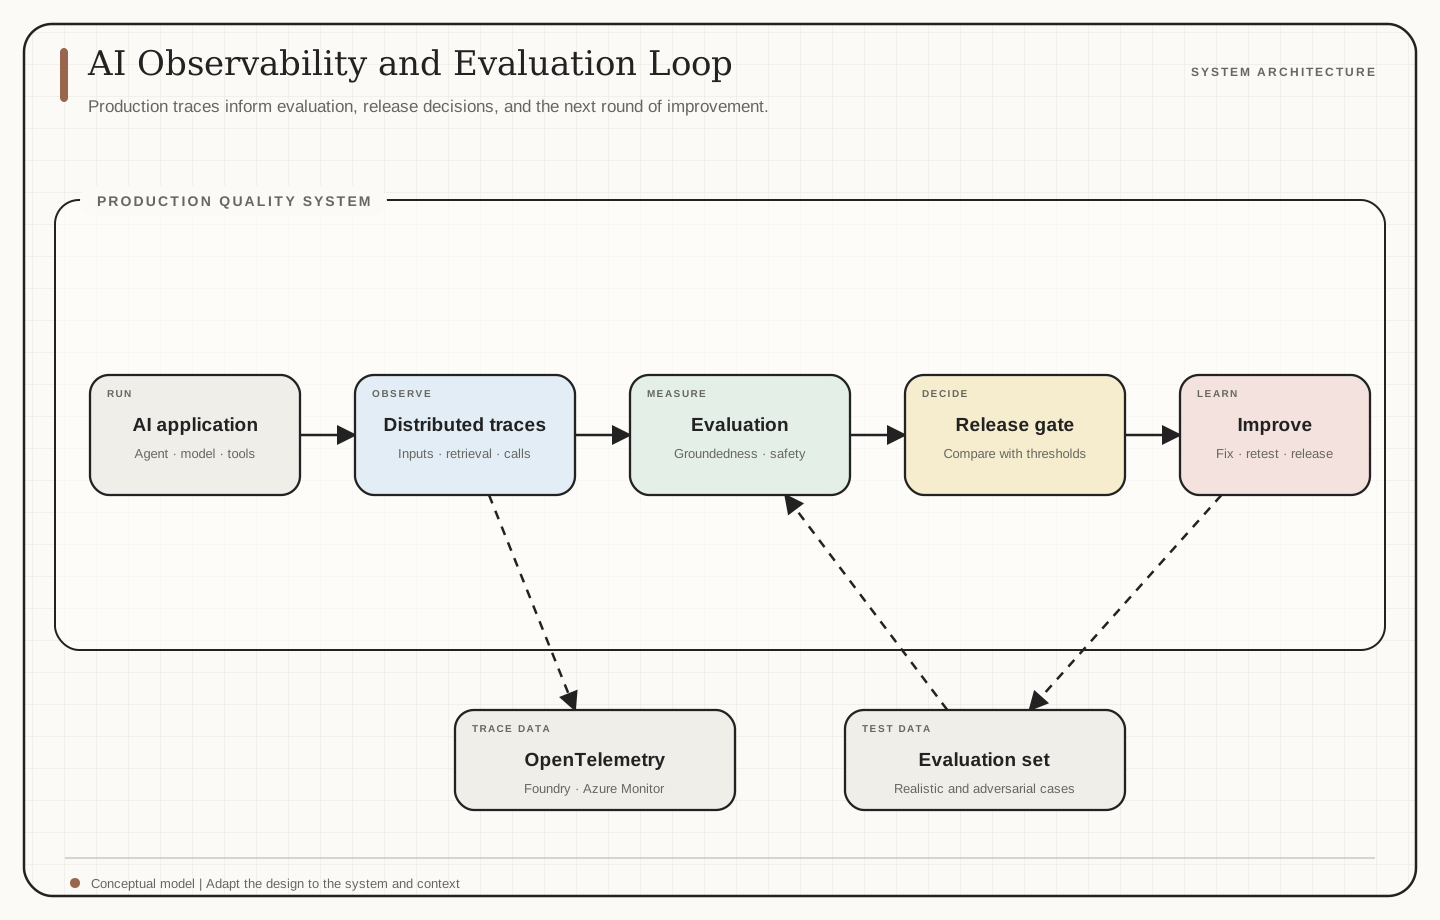
Microsoft Foundry describes observability as a lifecycle practice that combines evaluation, traces, logs, model outputs, and quality gates. The same operational principle applies outside Foundry: choose signals that map to user and system risks, then define how they will be protected and acted on. Microsoft Learn: Observability in generative AI
Distributed tracing for AI systems
A trace connects the steps of one workflow. For an agent, that might include the user request, retrieval query, selected documents, model call, tool arguments, tool result, and final response. Traces help locate latency and failure boundaries, but they do not establish that the model's reasoning was correct. Evaluate the output and action against expected behavior as well.
Foundry tracing uses OpenTelemetry and can record prompts, model and agent inputs and outputs, tool calls, intermediate steps, and execution metadata in connected telemetry systems such as Azure Monitor Application Insights. Trace contents may include customer or employee data. Restrict reader access, review data handling and retention, and avoid collecting sensitive fields that are not required for debugging. Microsoft Learn: Tracing and data handling
Evaluation metrics
Evaluation measures behavior against a defined task and dataset. Select metrics that correspond to the product's failure modes. For a retrieval-augmented answer, measure retrieval relevance, groundedness, and citation correctness. For a tool-using agent, measure task completion, correct tool selection, valid arguments, and policy compliance. Track latency, errors, and token use alongside quality.
Automated evaluators are signals, not proof of correctness. Validate them against human-reviewed examples and retain targeted manual review for high-impact cases. Foundry supports evaluation of datasets, generated outputs, and production traces with quality and safety evaluators. Microsoft Learn: Evaluation in Microsoft Foundry
Quality gates in CI/CD
Evaluation should run before release as well as after deployment. Build a representative dataset from normal traffic patterns, known failures, denied requests, ambiguous instructions, and adversarial cases. Version the dataset and evaluation configuration with the application.
A release workflow can run application tests, evaluate model or agent behavior, compare results with agreed thresholds, and stop deployment when critical checks regress. Teams build this gate in their CI/CD system; an evaluator does not automatically block a release. Continue to monitor production behavior and feed reviewed failures back into the test set.
Building trustworthy production AI
A useful operating loop connects the stages shown in the diagram: application traces and test data inform evaluation; evaluation informs a release decision; production failures become new test cases. Keep the loop specific to the workflow, and investigate failures before changing prompts or models so fixes address the actual boundary that failed.
A practical observability plan defines:
- Which traces, logs, and metrics are necessary to operate the system.
- How sensitive inputs, outputs, and retrieved content are redacted or protected.
- Who can read trace data and how long it is retained.
- Which quality and safety checks are release blockers.
- How incidents are triaged and how fixes are verified.
- How latency, availability, error rate, and token use are alerted on.
Conclusion
Observability makes agent behavior easier to inspect; evaluation measures it against explicit expectations. Production quality depends on both, plus data minimization, access controls, and a release process that acts on the results.
References
- Microsoft Learn. Observability in generative AI
- Microsoft Learn. Tracing and data handling in Microsoft Foundry
- Microsoft Learn. Evaluation in Microsoft Foundry